
A Case Study
Project Insights Tool
Client: GapTech
Gap’s IT teams utilize Agile software and processes to manage their projects; however, Scrum Masters were spending a lot of time pulling together relevant project metrics in order to efficiently run their teams. My team and I designed and created a lightweight project performance analytics product that enabled Scrum Masters to evaluate their teams in a simple but complete manner.
20
hours saved monthly
$3,200
in monthly cost savings
Overview
As a function of Gap IT’s Agile Software Development*, scrum masters must constantly measure the productivity of the cross-functional teams they manage on any given sprint of work. Gap’s scrum masters were wasting time pulling together data to simply track task progress and completions. Furthermore, even after finding the data, they were spending 1-3 hours a day trying to extract actionable insights about their team. Gap needed an automated reporting tool to 1) save the scrum masters’ time; 2) eliminate margins for error; and 3) standardize task measurement across the organization.
Along with the data engineers on my team, I knew we could easily automate their calculations; the more difficult challenge would be in designing a product that gave scrum masters actionable insights and context around their teams’ performance. For example, awareness of a team’s “velocity” metric (i.e., the speed at which a team completes a set amount of work in a given time), set in the context of proper design, would lead to direct actions from either the teams and/or the scrum masters to improve their performance. A centralized team management reporting tool that enabled Scrum Masters to see their team’s productivity would allow them to then optimize their teams’ performance and ability to meet deadlines.
Test & Iterate
Insight #1 Inconsistency: Each team had their own unique and often conflicting way to derive necessary team performance metrics.

Problem: Our MVP needed to address the scrum masters’ biggest pain point: inconsistent reporting. Our data engineers knew they could get the requisite standardized data across all teams; I needed to make that data easily consumable. The design challenge was that while standardization was required, there were one-off team nuances that called for team-specific views. For example, some teams only worked on one project sprint at a time while others would have multiple sprints running concurrently. While forcing scrum masters to track their team’s performance based on single sprints produced a clean user experience, scrum masters insisted they needed to track their teams with multiple sprints, which led to confusion among scrum masters around which sprints they were viewing in V1 of our product.
Design Solution: The way I solved the challenge was to design the module so that the sprint names reduce in size and line up left aligned one under the other when there was more than one sprint name value. In this way it was clear which sprint (s) the team was tracking, and how many sprints there are as there will only be one name to a line. I prioritized the comprehensiveness of the data for the scrum masters and compromised the simplicity of the single sprint view. I found that my solution to the conflicting priorities proved successful as I tested the new version with my scrum master users.
Insight #2 Scrum masters could not always remember the details of a workstream during a sprint, which made it difficult to assess whether the team was on track or not.
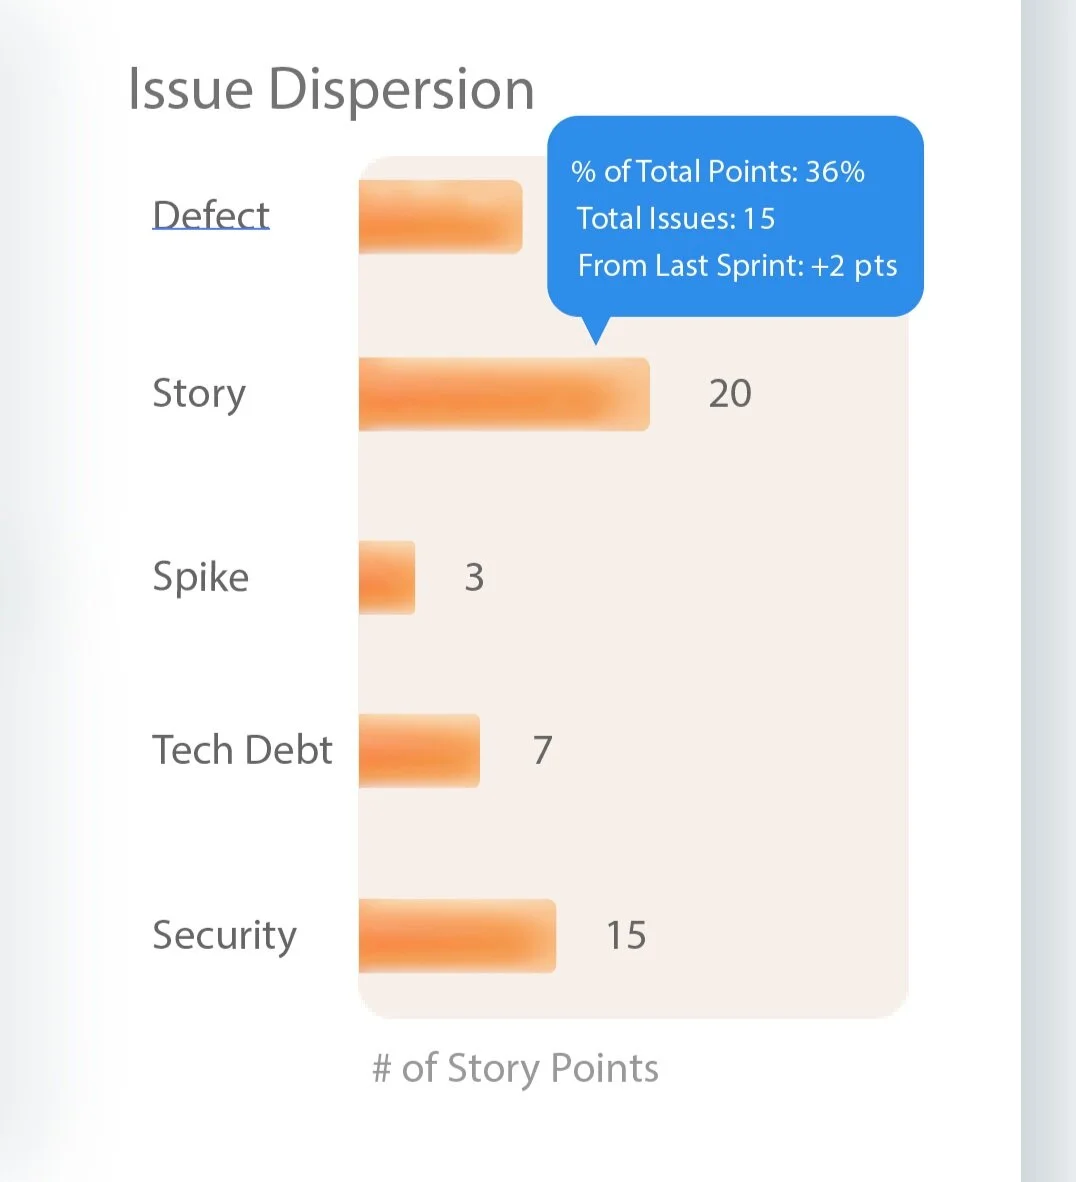
Problem: V2 of the product clearly met the scrum masters’ need for consistent and understandable data, but as I tested it with specific users, I uncovered another need that our product could address: how certain workstreams were tracking against their target deliverables. Scrum masters classify a project’s workstream in two ways: 1) by its “issue” type -- a categorization associated with the type of the work required (stories, security, tech debt, defect, spike); and 2) by its count of “points” -- a metric that represents the expected time and effort required to complete a workstream.
Design Solution: After interviewing scrum masters, I found that simply seeing a sprint’s points and issue type counts could easily jog their memory to remind them about what was being covered in a sprint and if they were tracking to the timeline or not.
For example, teams have tech debt goals set for themselves to track against. By looking back at the amount of tech debt (a specific “issue” type) they completed they can verify whether or not they are still on target or if they will need to plan more tech debt for the next sprint so that they are still on target.
Insight #3: Scrum masters needed more information about the productivity of their teams outside of the “total work completed” and performance against historical data that the previous reporting showed in order to properly assess the success of their initial planning.

Problem: Scrum masters are responsible for planning out a project team’s workstreams in a sprint. Using their best judgement, scrum masters determine a sprint’s priorities and how long it will take to complete to create a set of deliverables and a timeline (i.e., planning). This is necessary to set expectations both within the project team and externally with business partners who received the output of their work. Scrum masters often use historical performance as a gauge to do future sprint planning; however, they did not have a way to assess whether they did a good job planning past sprints to use as benchmarks as they planned the next sprint and why past sprints missed or hit the scrum masters original plan.
Design Solution: Prior to our analytics product, scrum masters could only access data around who had worked on what pieces of work in past sprints. While this was useful information, it did not tell them why a sprint may have taken longer. I addressed this need in our product in two ways: 1) I created a count of workstreams (sum of a “stories” metric and an “issues” metric) that needed to be added to a sprint after the initial planning commitment (i.e., the opening of the sprint); and 2) I added an indicator of improvement or decline from the previous sprint. These two pieces of information could both tell the scrum master if their current sprint was on track or not and why it may or may not be. I tested these two additions to the tool with users who expressed that the features benefited them as they could now see why their original planning was accurate or not to judge how to set future sprint expectations. For example, being able to see how often their teams were getting pulled into other initiatives mid sprint explained why a project was delayed and enabled them to more accurately know a team’s expected output in a given amount of time. Additionally, scrum masters could now communicate to leaders and business partners why certain sprints were going slower than expected.
Results
By creating a product that enabled users to evaluate project teams in a simple but complete manner, my team and I created a highly valuable tool that scrum masters now use for weekly reviews on a regular basis. Previously, they would spend hours putting a potentially inaccurate report together and consequently would give opaque and incomplete reports. Our tool increased the productivity of the Scrum masters and their teams by introducing automation, standardization, and key insights to their fingertips.
Since rolling out Project Insights tool
User base grew 30x
25% decrease in Scrum master prep time